Control group

Expected cell abundance

Beta(a0 = , b0 = )

The mean and standard deviation will change when you change a0 and b0, and vice versa.

Experimental group

~

Expected cell abundance

Beta(a0 = , b0 = )

The mean and standard deviation will change when you change a0 and b0, and vice versa.

Visualize Beta-distributions

The graph will update when the Beta-distributions change.

Statistical Test

Type

Parameters for SESOI

Result: False-negative rate β

Results pending calculating...
Lower is better. Each row correponds to a fixed number of control samples. Each row correponds to a fixed number of experimental samples. Values pass βth are shaded.

Control Group and Case Group

~

Control Group

Expected cell abundance

Beta(a0 = , b0 = )

Case Group

Expected cell abundance

Beta(a1 = , b1 = )

Visualization

The graph will update when the Beta-distributions change.

Statistical Test

Type

Parameters for SESOI

Result: False-negative rate β

Results pending calculating...
Lower is better. Each row correponds to a fixed number of control samples. Each row correponds to a fixed number of experimental samples. Values pass βth are shaded.

Instructions

The overall workflow is as follows. You can refer to the hover-over help information for definition of the parameters and commonly used values.
  1. Set the numbers of samples in control group and experimental group, M0 and M1. For paired test, there is only one M.
  2. Set mber of cells N0 and N1 in each sample.
  3. Set mean and standard deviation for proportion of a cell type. You can use the plot to view the distribution to confirm your choice.
  4. Read from the output table. The shaded ones are the ones with high power.
Some other paramters as follows can also be changed.
  • Set a and b for the underlying beta distribution for cell abundance, in lieu of mean and standard deviation.
  • Set α, it is the threshold for a significant p-value. 0.05 and 0.01 are commonly used.
  • Set threshold βth for preferred false negative rate. It is the probability of failing to yield a siginificant result.
  • Choose from one-sided test and two-sided test.
  • Q&A

    • Q: How to set correlation for paired t-test?

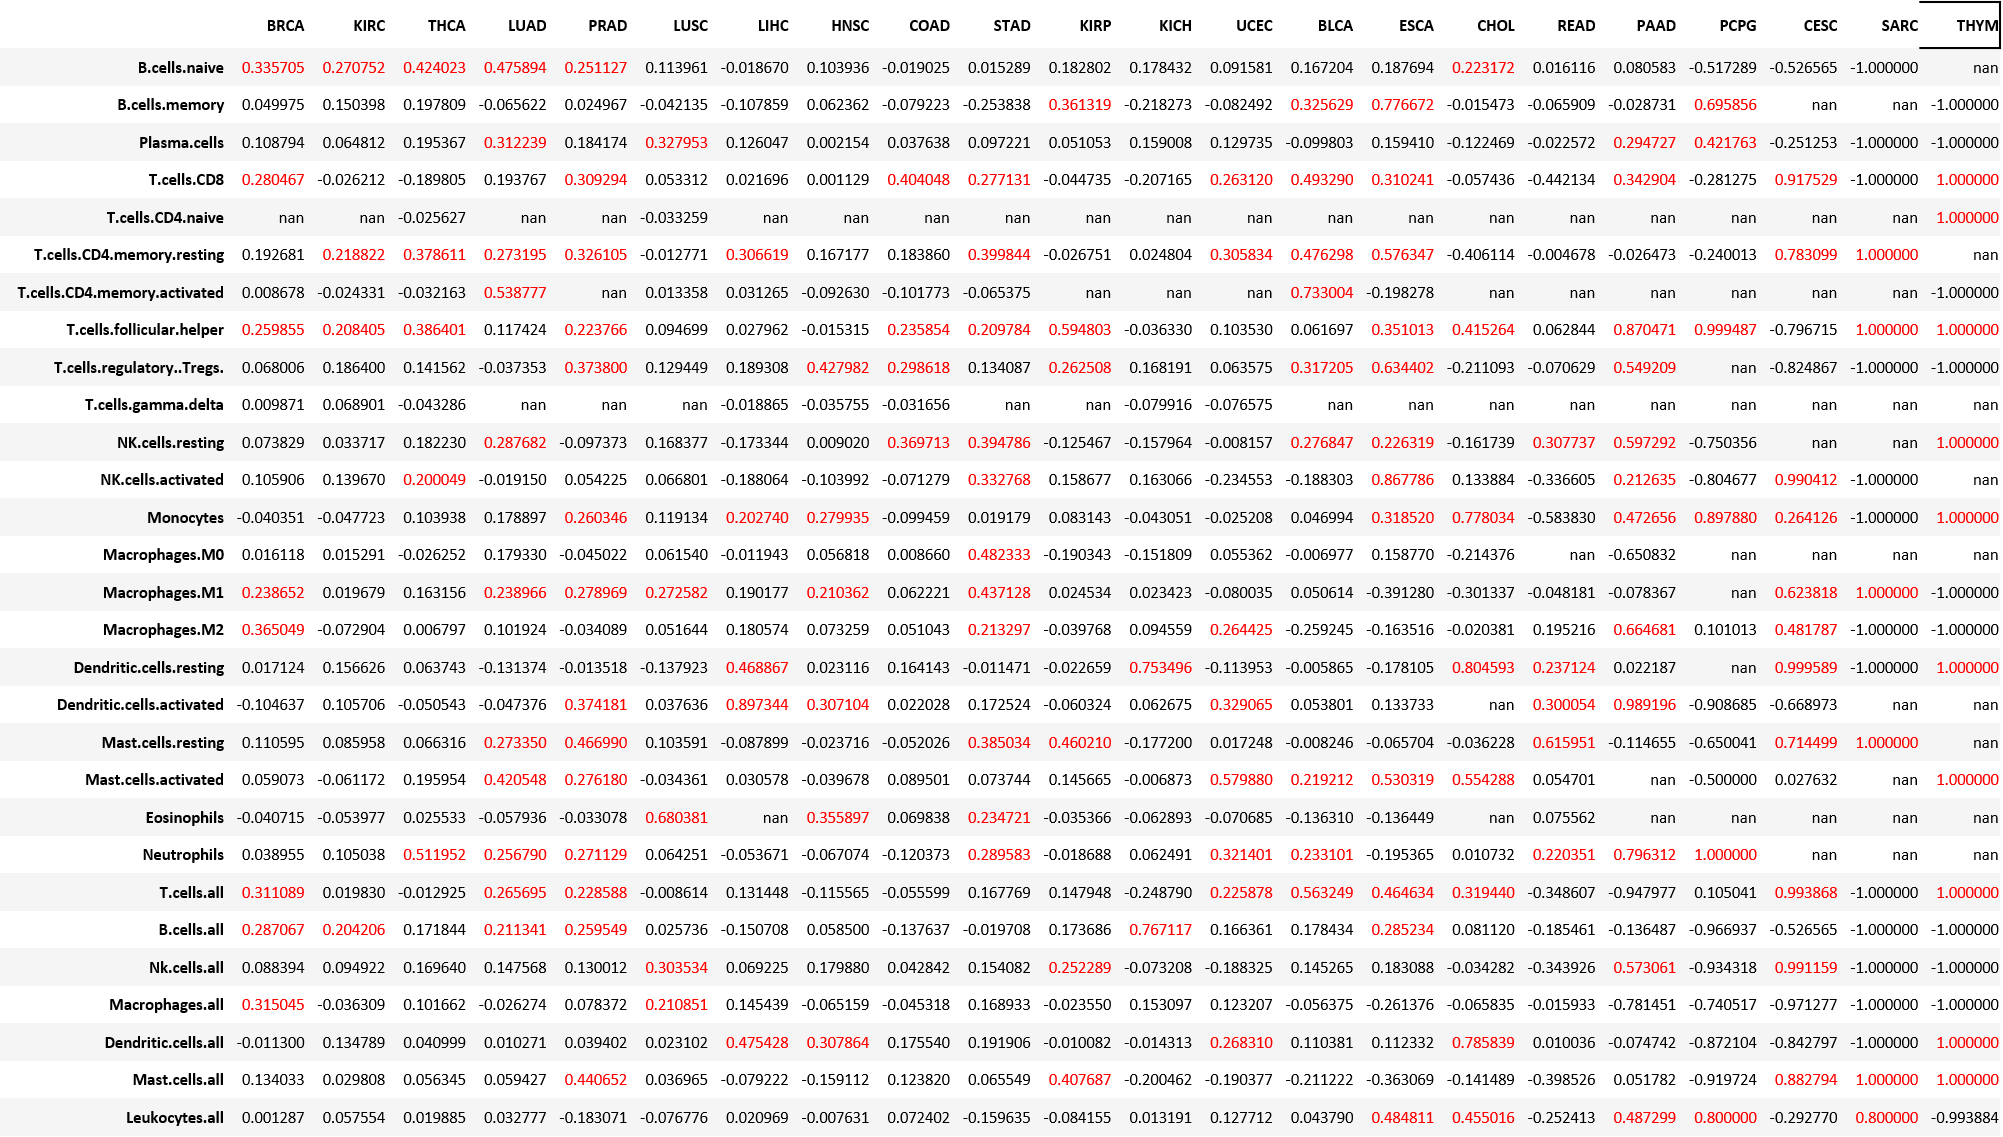
      A: It should be determined on a case by case basis. We have calculated the correlation between immune cell types in solid tissue normal and primary solid tumor in TCGA data deconvolved by CIBERSORT. Please refer to the correlation and 95% confidence interval.

    • Q: What is a t-test with SESOI (smallest effect size of interest)? When should I use it?

      A: It is a t-test with a more stringent rule about what is considered a meaningful change.

      You can use it to verify a particular effect. For example, if you set SESOI to 0.05, and choose "verify", the question it asks is "are the cases significantly higher than (controls + 0.05)?". You can also use "falsify" to prove that there is no significant increase of the said SESOI. The question then becomes "are the cases significantly lower than (controls + 0.05)?" Note that the when SESOI is negative, the "verify" will test for "significantly lower", and so does the "falsify".

    • Q: What is a TOST test (two one-sided tests for equivalence)? When should I use it?

      A: It tests if the cases are (1) significantly higher than the (controls - |lower_bound|), and (2) lower than the (controls + upper_bound).

      Because simply failing a t-test does not prove that there is no effect, as it can also be because of an insufficient sample size. If you want to prove that the difference between the cases and the control are "equivalent", TOST is the simplest choice.

      Note that we assume the false-negative rate is the sum of the false-negative rate of both sides, truncated at 1.